Wednesday, February 8, 2012

Trade triggers using spikes

Given that spikes are caused by traders highly emotional responses to news and/or fundamental data, the odds are good that spikes often mark important turning points both on an intra-day and on a longer term basis. This approach needs to be backed up by an operational procedure. Here is a way to trade them:

1 Isolate a volume spike on an intra-day chart. I like the 5-minute chart for this porpouse.
2 Note the price bar high and low for the period of the spike.
3 BUY on a bar close above the price high
4 Use the opposite side of the trade o the middle of the bar (depends on each trader) for a stop loss
5 Use only active markets only.

In the following example I have a recent trade on YPF, I opened a position on u$s34 after the price close over the long green candle.
I set a stop loss in the middle of that candle that also was support last Thursday and after been broken acted as resistance on monday.

Wednesday, February 1, 2012

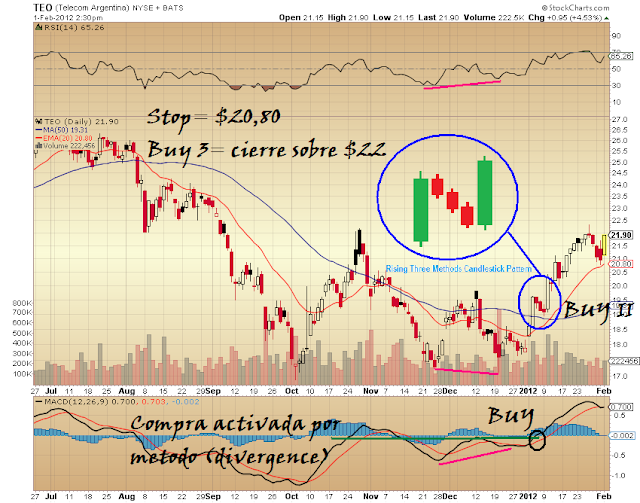
Telecom Argentina SA (TEO) Seguimiento


Por ahora mantengo y dejo los beneficios correr. Actualizo mi stop loss/profit a u$s20,80. Posible nueva compra para promediar hacia arriba el precio sera dada por un cierre sobre u$s22.

OpenTable, Inc. (OPEN) Seguimiento


Ensucie mucho el chart, sino se entiende me preguntan. Lo importante a destacar es que el activo se continua moviendo de manera prolija. Proximo "add point": cierre sobre u$s50 o bien un testeo de los u$s45. Stop loss cierre debajo de u$s44,80. (click sobre el chart para ampliarlo) Tambien les recuerdo que los gaps (breakaway, continuation and exhaustion) fueron indicadores del cambio de tendencia que se ha dado (remitirse a post anterior)